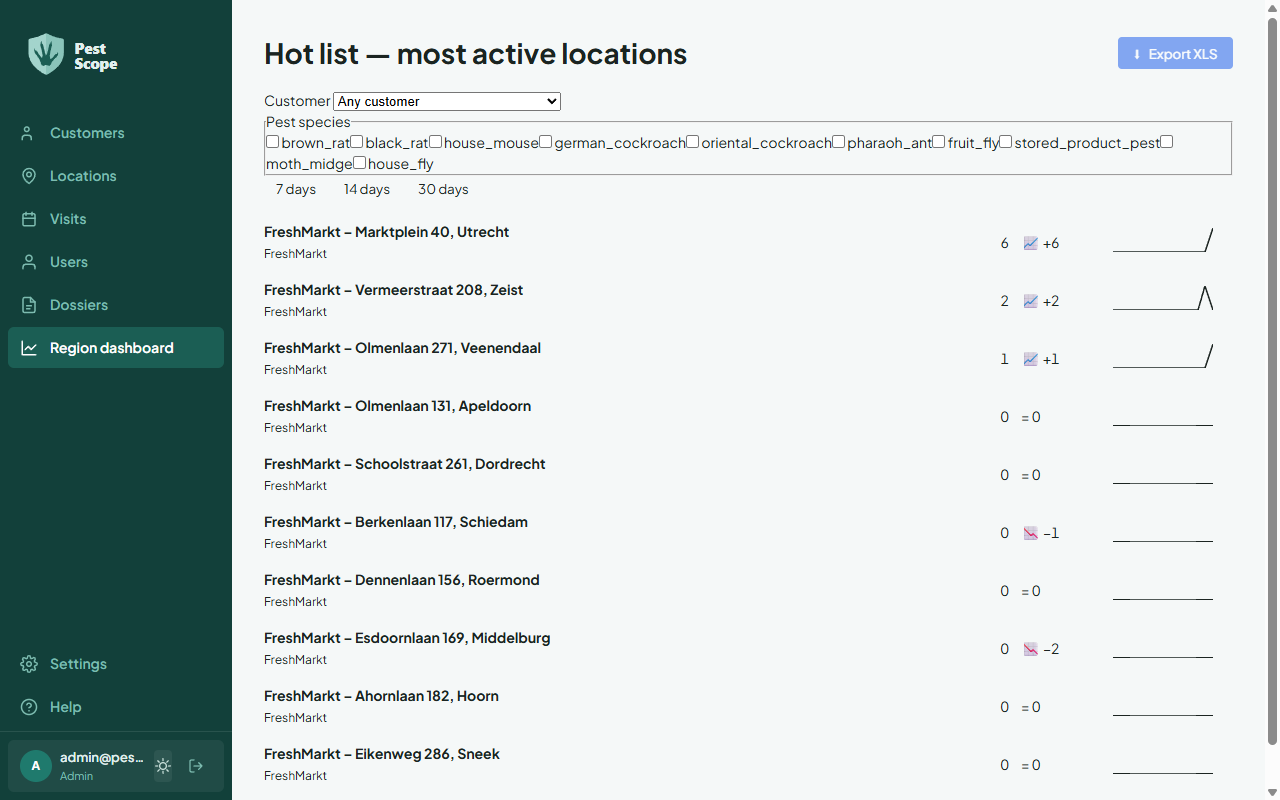
Read the hot list on the region dashboard
These steps show you how to read the hot list: the overview of locations with the most activity. That way you quickly see where the pressure is highest. For the Admin, Office, or Region manager role.
Before you start
Section titled “Before you start”- The Admin, Office, or Region manager role.
- Choose Dashboard in the sidebar. The Region dashboard opens with the Hot list — most active locations.
- Narrow the list with the filters: choose a Customer (or Any customer), optionally Pest species, and a Period (7, 14, or 30 days).
- Read the list from top to bottom: the locations with the most activity are at the top. Choose a location to go to its page.
- Choose Export XLS to download the overview as an Excel file.
Result
Section titled “Result”You have an up-to-date picture of the busiest locations within your selection and can share the overview or analyse it further in Excel.